
Spatial Equity Data Tool
An interactive tool helps city officials, community organizations, and residents quickly and clearly assess spatial and demographic disparities in their cities.
Project Type
Product
Deliverables
Vision & Strategy, UX, UI, Interaction Design
Agency
The Urban Institute

Overview
The problem: How can cities ensure that resources are equitably distributed to all residents?
Biases in the datasets policymakers use to make decisions lead to disparities in how resources are distributed throughout a city. City officials, community organizations, and residents need a way to quickly assess spatial and demographic disparities so they can see how equity is playing out in their communities.
The goal: To create an accessible, user-friendly product that assesses the racial, economic, and geographic disparities present in user-uploaded data.
Discover and define
The build and research teams worked together closely on all stages of the project through frequent brainstorming and feedback sessions. We thought carefully about the voice and tone of this tool and carried that through in design, text, and interactivity.
Prototype and test
The primary user’s voice drove every step of development, including conducting interviews with target users to conceptualize the tool, soliciting user feedback on the wireframes and mock-ups, and conducting beta tests of a working prototype.
Wireframes for “upload your own data” user flow
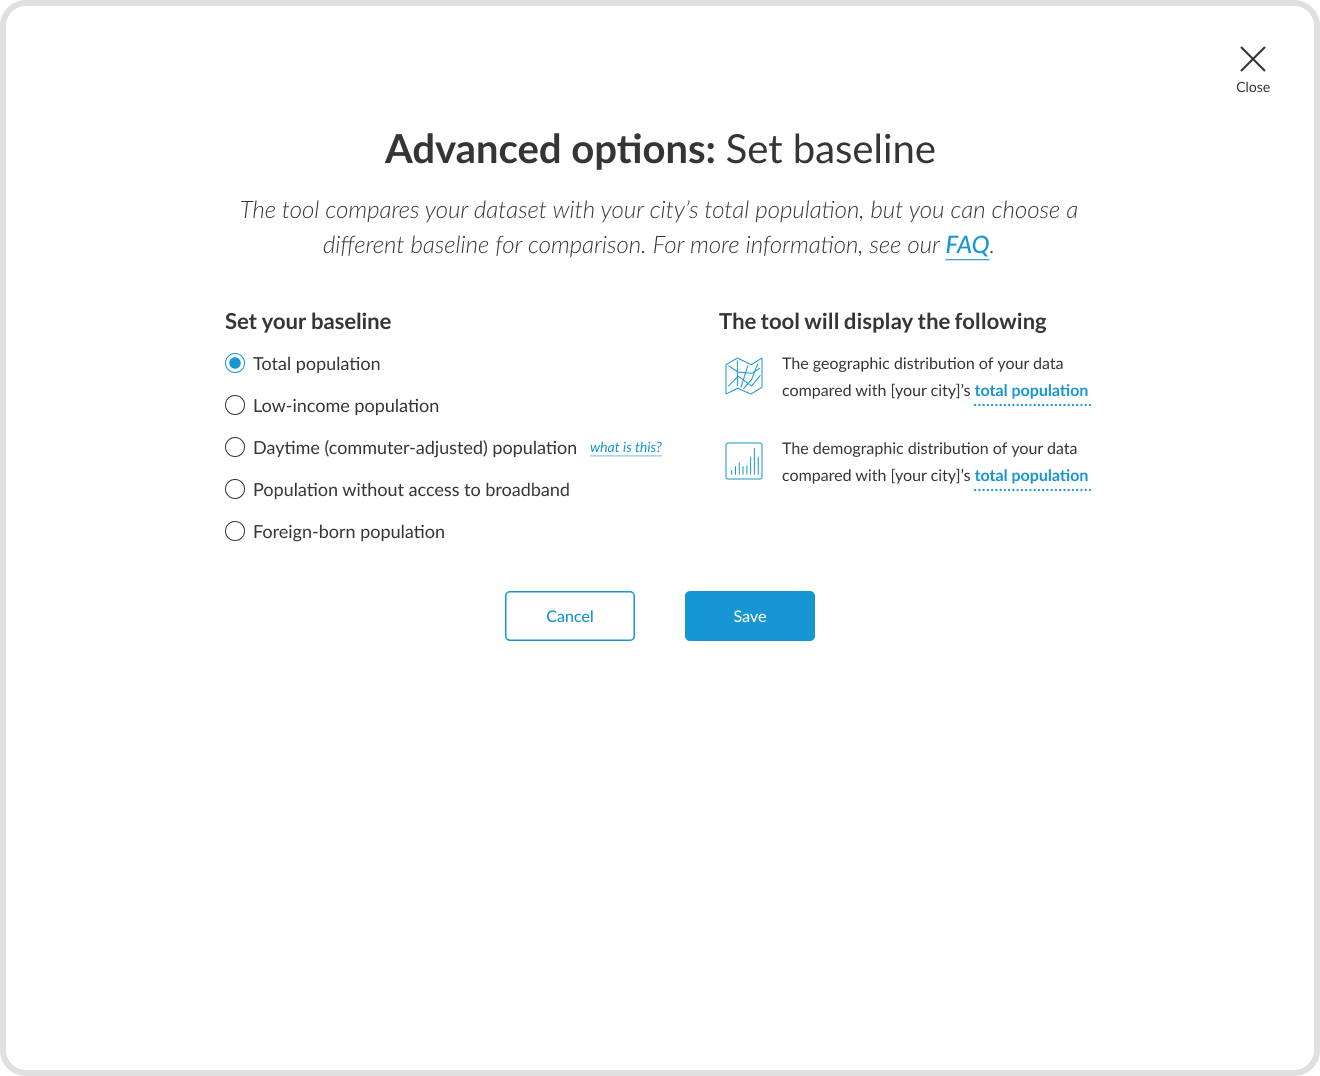
High-fidelity prototype for “upload your own data” user flow
The Spatial Equity data tool is one of the first Urban interactive features where users can upload and analyze their own data. In seconds, the tool performs analyses that would have previously been prohibitively expensive, such as comparing representativeness over time, across policy domains, and even across cities. The tool is a valuable resource for city GIS and planning staff tasked with allocating resources, equity staff measuring progress towards equity goals, and advocates promoting more equitable distribution of resources.
Final product
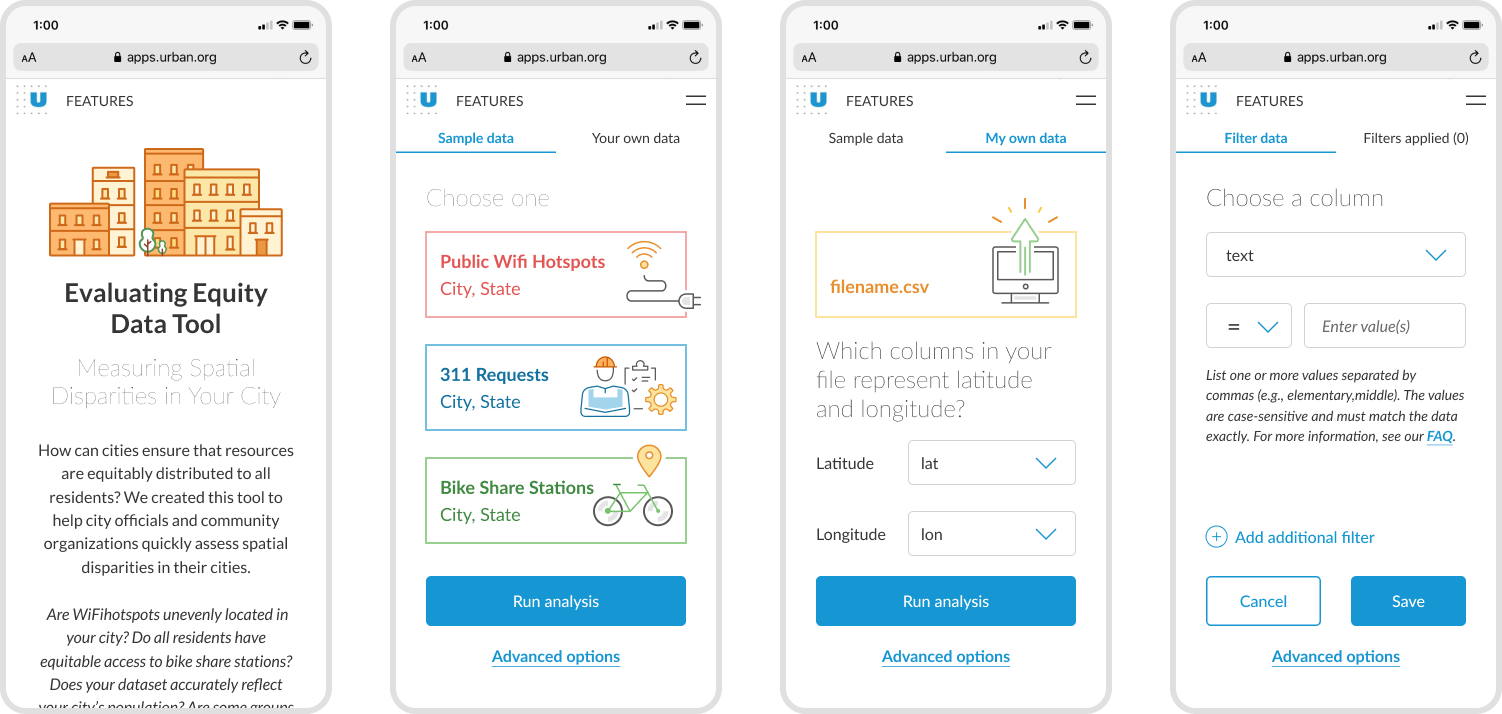
User flow for running a dataset (large screens)


Data analysis (large screens)
Final screens (mobile)

Impact
This tool represents what we hope is a first step in the “democratization of data” so that anyone, regardless of technical background and capability, can perform analyses and understand why inequities exist in their community. This is particularly groundbreaking for smaller organizations and municipalities that don’t have the staff, funds, or technical capacity to perform their own equity analyses.
The Bloomington Pedestrian and Bike Safety Commission used the tool to analyze equity in sidewalk funding allocations. The Washington Joint Legislative Audit and Review Committee used it to analyze equity in the distribution of solar panel tax credits. Users have also reported using the tool to study the placement of traffic cameras in Chicago, 911 requests for service in Denver, Amazon facilities in Chicago, and childcare centers in Marin County.
Enabling users to bring their own datasets and questions to the tool has yielded creative applications. For example, one person used the tool to find that McDonald’s locations with broken ice cream machines were concentrated in Black and Latinx neighborhoods, which sparked considerable interest in the tool.

Media and press attention
Over 8,500 pageviews
Significant media interest, including highlights by Vice, Eater, the National League of Cities, the Harvard Kennedy School’s Data-Smart City Solutions site, and the American Planning Association’s podcast.
The Data@Urban blog post introducing the tool was one of Urban’s top five most-viewed posts of 2020.
Key takeaways and next steps
Balancing user-friendliness and technical rigor, the final product’s success is a direct result of the significant collaboration and group work between members of the team. The users we consulted were very happy with the final product, remarking that the tool “conveys the perfect blend of friendly and rigorous” (Cass Wilkinson, Data Educator with the Children’s Hospital of Philadelphia) and that “the tool is super awesome! I had a long wish list, and this has everything and more.” (Zachary McDade, Senior Statistical Researcher at City of Denver). Since its launch, Cass has promoted the tool to their network and Zach has used the tool to analyze the distribution of 911 requests for service in Denver.
November 2021 update

While we originally designed the tool with city officials, community organizations, and residents as the target audiences, we have seen considerable interest in the tool from a wide range of audiences working at different geographic levels. And with the Biden administration's executive order on racial equity, which charges federal agencies with conducting "equity assessments" of all policies and programs, there is growing interest in using the tool for studies at the federal level.
Expanded functionality now allows users to perform analyses at the national, state, and county levels.